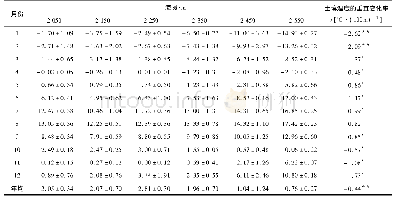
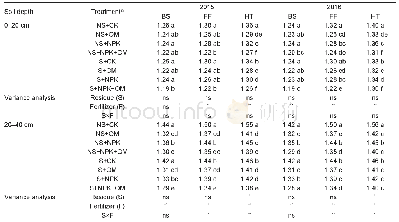
《Table 2 Average soil temperature at 5 and 25 cm layers under each mulching treatment with days afte
 提示:宽带有限、当前游客访问压缩模式
本系列图表出处文件名:随高清版一同展现
《"Effects of mulches on water use in a winter wheat/summer maize rotation system in Loess Plateau, China"》
Note:The data are the average values of soil temperature over the ridges and in the furrows.Different letters within a line indicate significant differences among treatments at P<0.05 level at the same soil layer.DAS,days after sowing.
We analyzed the effects of different mulch treatments on soil temperature(at 5 and 25 cm soil layers)during 2014 in maize field(Table 2).The dynamics of average soil temperature among treatments were consistent with a decreasing trend and a reducing difference throughout the maize season.During the observation periods,the average soil temperature at 5 cm layer ranged from19.4°C to 42.5°C,with the highest and lowest values occurred in M1 and M2,respectively.Compared with M3,soil temperatures significantly increased in M1 within 40 days after sowing(DAS),while soil temperature averagely decreased by 1.4°C in M4 within 50 DAS.M1 had higher soil temperatures than M3 from 50 to 100 DAS and M3 had higher soil temperatures than M4 from60 to 100 DAS(except 70 DAS),but the differences between them were not significant.
| 图表编号 | XD0020360300 严禁用于非法目的 |
|---|---|
| 绘制时间 | 2018.04.01 |
| 作者 | YIN Minhua、LI Yuannong、XU Yuanbo、ZHOU Changming |
| 绘制单位 | Key Laboratory of Agricultural Soil and Water Engineering in Arid and Semiarid Areas, Ministry of Education, Northwest A&F University、College of Water Resources and Architectural Engineering, Northwest A&F University、Key Laboratory of Agricultural Soil an |
| 更多格式 | 高清、无水印(增值服务) |