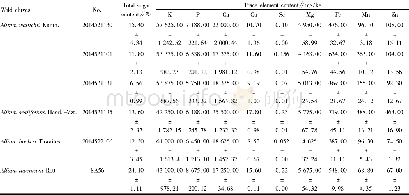
《Table 5 Choices of locality elements in the northern, central, and southern sections》
 提示:宽带有限、当前游客访问压缩模式
本系列图表出处文件名:随高清版一同展现
《Regional difference and dynamic mechanism of locality of the Chinese farming-pastoral ecotone based on geotagged photos from Panoramio》
Next,we further investigated the quantity and density distributions of locality elements reflected from each data point from the overall perspective.We utilized NVivo 11.0 software to conduct fragmentation on the data information,and obtained 91,644 items of information.Based on grounded theory,we categorized the items into 52 minimum units,with each unit representing only one locality element.Then,we coded every locality element into one free node,and,finally,obtained 9 dendriform nodes from classification and combination.The frequency and rate statistical information were shown in Table 1.
| 图表编号 | XD0020360500 严禁用于非法目的 |
|---|---|
| 绘制时间 | 2018.04.01 |
| 作者 | WANG Fang、LI Yixi、DONG Ying、ZHU Xiaohua |
| 绘制单位 | Sino-German Joint Laboratory on Urbanization and Locality Research (UAL), College of Architecture and Landscape Architecture, Peking University、Key Laboratory for Earth Surface Processes, Ministry of Education, Peking University、Sino-German Joint Laborato |
| 更多格式 | 高清、无水印(增值服务) |
查看“Table 5 Choices of locality elements in the northern, central, and southern sections”的人还看了
-

- Table 1.regional contributions of total ct At frequency in the northern hemisphere in summer (June–July–August) 2008–201
-

- Table 2 List of files in the“Time series of land surface phenology dataset in Central Asia(1982–2015)”


