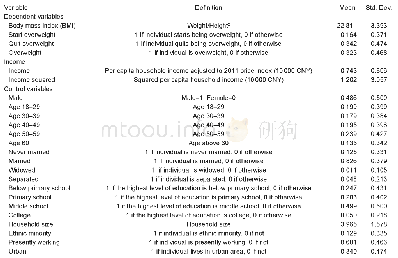
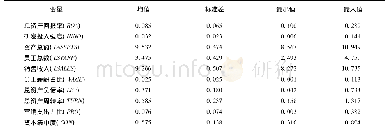
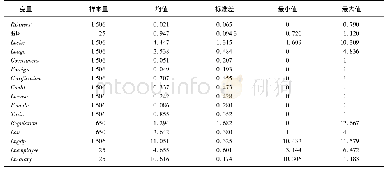
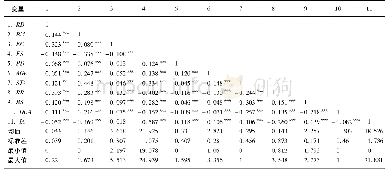
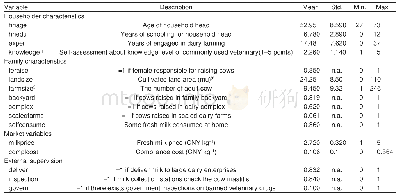
《Table 2:Descriptive Statistics of Primary Variables after Matching》
 提示:宽带有限、当前游客访问压缩模式
本系列图表出处文件名:随高清版一同展现
《How China's Grain-for-Green Project Contributes to Farmers' Income Growth》
To ensure that the treatment group and control group share a common secular trend without policy intervention,this paper first conducts a PSM of the samples.In conducting PSM,we matched various indicators of GGP household at last year before participating the project with the data of non-GGP household at the same time.For example,if a household who participated in the GGP in 2007,their various indicators at year of 2006 are matched with the data of non-GGP farmers at the year of 2006.We followed the method of radius matching.By configuring a relatively rigorous radius value,we enhanced the homogeneousness of the samples.This paper controls the matching radius at 0.00001,and matched6,406 households,less than 20%of the total samples.Meanwhile,this paper conducts a balance test of the matching results8.After matching,the composition of samples in various years is shown in Table 1.
| 图表编号 | XD007228900 严禁用于非法目的 |
|---|---|
| 绘制时间 | 2018.05.08 |
| 作者 | 王庶、岳希明 |
| 绘制单位 | School of Finance, Renmin University of China、School of Finance, Renmin University of China |
| 更多格式 | 高清、无水印(增值服务) |
