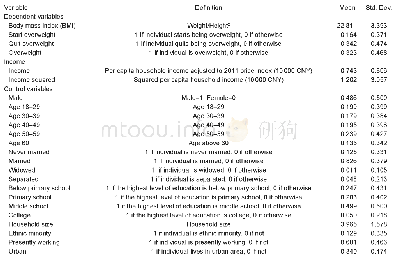
《Table 1 Definition and descriptive statistics of key variables1)》
 提示:宽带有限、当前游客访问压缩模式
本系列图表出处文件名:随高清版一同展现
《Low-income and overweight in China:Evidence from a life-course utility model》
1) Authors’estimations based on the China Health and Nutrition Survey(CHNS)samples.
To verify our theoretical model,the relation between income and BMI is estimated by applying OLS estimation.The relations between income and overweight initiation,cessation,and participation are estimated by applying maximum likelihood estimations for Probit models.Pampel et al.(2012)argue that there might exist differences between males and females and in socially constructed body weight norms and ideas.Estimations are,thus,more reliable if different samples are estimated for males and females.Similarly,different samples are used for urban and rural residents to check for potential heterogeneity of the income effect.
| 图表编号 | XD0082720200 严禁用于非法目的 |
|---|---|
| 绘制时间 | 2019.08.20 |
| 作者 | REN Yan-jun、Bente Castro Campos、Jens-Peter Loy、Stephan Brosig |
| 绘制单位 | Institute of Agricultural Economics, University of Kiel、Leibniz Institute of Agricultural Development in Transition Economies、Institute of Agricultural Economics, University of Kiel、Institute of Agricultural Economics, University of Kiel、Leibniz Institute |
| 更多格式 | 高清、无水印(增值服务) |


