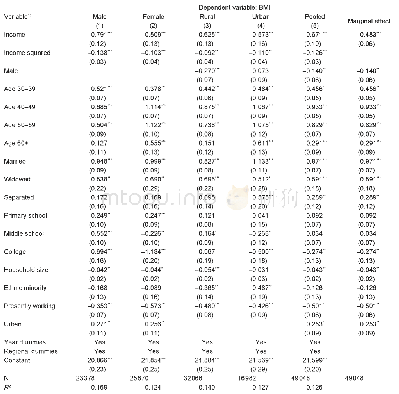
《Table 2 OLS estimation of the relationship between income and body mass index (BMI)》
 提示:宽带有限、当前游客访问压缩模式
本系列图表出处文件名:随高清版一同展现
《Low-income and overweight in China:Evidence from a life-course utility model》
1) Time controls include year dummies for 1991,1993,1997,2000,2004,2006,2009,and 2011.Regional controls include dummies for Chongqing,Beijing,Liaoning,Heilongjiang,Shanghai,Jiangsu,Shandong,Henan,Hubei,Hunan,Guangxi,and Guizhou.Source:aut
The estimation results for the male and female subsamples,as well as for the urban and rural subsamples are also presented in Table 2.Generally,the coefficients of income and income squared,are consistent with the estimation results for the pooled sample.Interestingly,the critical value of the BMI-income quadratic curve for females(approximately 24 709 CNY)is relatively lower than the value of 28 659 CNY for males;this suggests that females tend to reduce their BMI at a relatively lower income level compared with males.Looking at the urban and rural samples,we find that the critical value for the urban sample is approximately26 045 CNY and approximately 33 967 CNY for the rural sample.The results also suggest that urban residents are more likely to reduce their BMI at a lower income level than are rural residents.
| 图表编号 | XD0082720100 严禁用于非法目的 |
|---|---|
| 绘制时间 | 2019.08.20 |
| 作者 | REN Yan-jun、Bente Castro Campos、Jens-Peter Loy、Stephan Brosig |
| 绘制单位 | Institute of Agricultural Economics, University of Kiel、Leibniz Institute of Agricultural Development in Transition Economies、Institute of Agricultural Economics, University of Kiel、Institute of Agricultural Economics, University of Kiel、Leibniz Institute |
| 更多格式 | 高清、无水印(增值服务) |
查看“Table 2 OLS estimation of the relationship between income and body mass index (BMI)”的人还看了
-

- 表2 安徽传统村落空间分布与坡度关系Table 2 The relationship between spatial distribution and slope of Anhui traditional village
-

- 表4 安徽传统村落空间分布与高程关系Table 4 The relationship between spatial distribution and altitude of Anhui traditional village
-

- 表5 安徽传统村落空间分布与平面曲率关系Table 5 The relationship between spatial distribution and plan curvature of Anhui traditional villag


