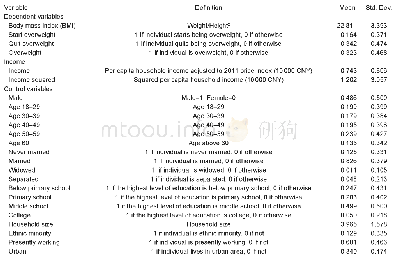
《Table 1 Statistical description of independent variables》
 提示:宽带有限、当前游客访问压缩模式
本系列图表出处文件名:随高清版一同展现
《Planning for a Healthy City: The Influence of Built Environment on Elderly's Body Mass Index》
Source:Compiled by the author according to the survey data.
(4) Only when the distance between living place and leisure and fitness place is 1 or 2,its impact on the BMI of the elderly is significant(otherwise when it is 3 or 4,the impact is not significant),indicating that when the leisure and fitness place is more than 1,000 m away,it is no longer attractive to the elderly and can not be referred as an influencing factor.When the distance is within 1000 m,the impact is significant and decays with the distance getting longer.To be specific,the influence coefficient is 2.913 or 1.601 respectively when the distance is<500 m or500–1,000 m,proving that the closer distance and the better accessibility are related to the greater attractiveness of leisure and sport activities of the elderly,which in turn leads to a lower BMI(see Table 2).
| 图表编号 | XD0012619100 严禁用于非法目的 |
|---|---|
| 绘制时间 | 2018.03.01 |
| 作者 | Chen Chun、Chen Yong、Yu Li、Zhou Wei、Liu Jinxin |
| 绘制单位 | School of Architecture and Urban Planning, Chongqing Jiaotong University@Liu Jinxin |
| 更多格式 | 高清、无水印(增值服务) |


