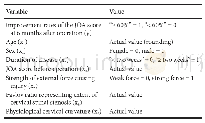
《Table 2 All accessors of the factors in the surgical prognostic model for cervical spinal cord inju
 提示:宽带有限、当前游客访问压缩模式
本系列图表出处文件名:随高清版一同展现
《Establishment and verification of a surgical prognostic model for cervical spinal cord injury without radiological abnormality》
JOA:Japanese Orthopaedic Association.
Binary logistic regression analysis was adopted for statistical modeling(Royston et al.,2009).Seven potential factors were recorded:age,sex,strength of external force causing injury,duration of disease,extent of cervical spinal stenosis,Japanese Orthopaedic Association score,and physiological cervical curvature.The duration of disease was stratified as<2 or>2 weeks(Chen et al.,2014).The external wounding forces were stratified as weak or strong.Cervical spinal stenosis was evaluated using the Pavlov ratio.Some scholars have used the Japanese Orthopaedic Association improvement rate to evaluate the prognosis of spinal cord injury as follows:≥75%is excellent,50%to 74%is good,25%to49%is effective,and<25%is poor or invalid(Grosso et al.,2013).The treatment results were evaluated based on the improvement rates,especially at 6 months postoperatively,with a threshold value of 60%;if the improvement rate was≥60%,the disease was considered almost cured,while an improvement rate of<60%indicated the lack of curative effect.We regarded the rate of improvement in the Japanese Orthopaedic Association score after the operation as a dichotomous dependent variable and the seven potential factors as independent variables.Stepwise selection of variables was used to obtain a regression model.All accessors of the factors are listed in Table 2.Because of the different measurement units of the partial regression coefficients in the multiple regression equations,the coefficients could not be compared.Therefore,we eliminated the influence of metrology with standardized partial regression coefficients and compared the relative contribution size of each independent variable through odds ratios(ORs).
| 图表编号 | XD0040614000 严禁用于非法目的 |
|---|---|
| 绘制时间 | 2019.04.01 |
| 作者 | Jie Wang、Shuai Guo、Xuan Cai、Jia-Wei Xu、Hao-Peng Li |
| 绘制单位 | Second Affiliated Hospital of Xi'an Jiaotong University、Second Affiliated Hospital of Xi'an Jiaotong University、Second Affiliated Hospital of Xi'an Jiaotong University、Second Affiliated Hospital of Xi'an Jiaotong University、Second Affiliated Hospital |
| 更多格式 | 高清、无水印(增值服务) |
查看“Table 2 All accessors of the factors in the surgical prognostic model for cervical spinal cord injury without radiologic”的人还看了
-

- Table 1 Changing trends of climate factors during the entire growth period of maize in different regions
-

- Table 1 The value of all types of ecological service function of mountain glaciers in the Tianshan Mountains, Northwest


