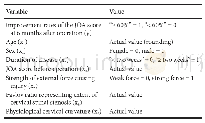
《Table 2 Evaluation of all the sampling points in optimal spectral window based on statistics》
 提示:宽带有限、当前游客访问压缩模式
本系列图表出处文件名:随高清版一同展现
《基于DOAS及统计量的低浓度SO_2测量方法(英文)》
*There are 137sampling points in optimal wavelength range 294~308nm,Table 2just takes many sampling points for example.**The optimal point set has 36optimal sampling points used for deducing optimal differential absorption cross section.
According to Section 2.2and Table 1,transmitted intensity Im(λi)was obtained at concentration cm.Thus differential absorption cross section was acquired(Fig.3),where different volatility is presented in different wavelength ranges.By means of preliminary concentration retrieval and theoretical inference[10,17],combined with amplitude and volatility as well,the spectral window 285~318nm was selected for following analysis(Fig.4).Obviously,compared with Fig.3(c),Fig.4(a)performs superior consistency.In accordance with average value and standard deviation in Fig.4(b),spectral window 285~294nm was abnegated because of its larger volatility,while spectral window 308~318nm was also abandoned owing to its lower magnitude.Optimal spectral window 294~308nm,where there are 137sampling points via the spectrometer,was acquired finally.
| 图表编号 | XD0023371500 严禁用于非法目的 |
|---|---|
| 绘制时间 | 2018.02.01 |
| 作者 | 张豹、高潮、郭永彩、刘国庆、陈方 |
| 绘制单位 | 重庆大学光电工程学院光电技术及系统教育部重点实验室、重庆大学光电工程学院光电技术及系统教育部重点实验室、重庆大学光电工程学院光电技术及系统教育部重点实验室、重庆大学光电工程学院光电技术及系统教育部重点实验室、重庆大学光电工程学院光电技术及系统教育部重点实验室 |
| 更多格式 | 高清、无水印(增值服务) |
查看“Table 2 Evaluation of all the sampling points in optimal spectral window based on statistics”的人还看了
-

- Table 1 The 5 planktonic diatom taxa with dominance degree D>0.1 in at least one sampling points and 7 dominant species


