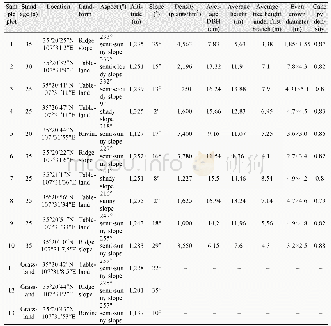
《Table 2 Data of sampling point A from experimental plots in May,2012》
The results demonstrated that root biomass changed significantly in the warming treatment during the growing season,with differences by month and soil depth(Figure 2)[21].
| 图表编号 | XD0027628100 严禁用于非法目的 |
|---|---|
| 绘制时间 | 2017.12.25 |
| 作者 | 徐满厚、温静、张世雄、杨晓艳 |
| 绘制单位 | 太原师范学院地理科学学院、太原师范学院地理科学学院、太原师范学院地理科学学院、太原师范学院地理科学学院 |
| 更多格式 | 高清、无水印(增值服务) |
查看“Table 2 Data of sampling point A from experimental plots in May,2012”的人还看了
-

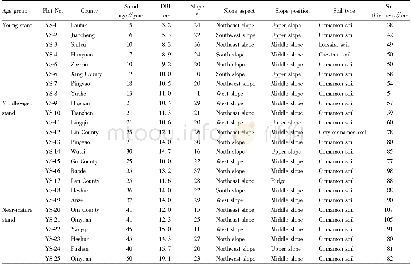
- Table 2 Information of sample plots in the Zhonggou River basin in the Loess Plateau of Gansu province
 提示:宽带有限、当前游客访问压缩模式


