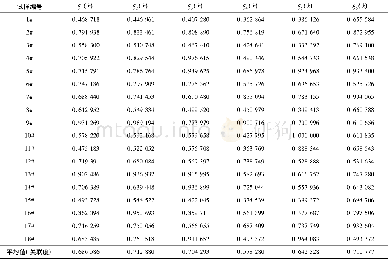
《Table 3 Measured concentration and relative error in 18th, 19th, 21th of May》
 提示:宽带有限、当前游客访问压缩模式
本系列图表出处文件名:随高清版一同展现
《基于DOAS及统计量的低浓度SO_2测量方法(英文)》
Proper spectral window selected in the paper is 294~308nm,and optimal sampling points in the window is also acquired by statistics and DOAS.According to Section 1,concentration of SO2 can be calculated by optimal dataset of differential absorption cross section.As shown in Fig.6(b)and Table 3,relative error is less than 1.7%,full scale error is under 1.3%.In many measurement range,relative error can be reduced to 0.8%.Moreover,measurement concentration shows favorable repeatability within 72h.
| 图表编号 | XD0023371400 严禁用于非法目的 |
|---|---|
| 绘制时间 | 2018.02.01 |
| 作者 | 张豹、高潮、郭永彩、刘国庆、陈方 |
| 绘制单位 | 重庆大学光电工程学院光电技术及系统教育部重点实验室、重庆大学光电工程学院光电技术及系统教育部重点实验室、重庆大学光电工程学院光电技术及系统教育部重点实验室、重庆大学光电工程学院光电技术及系统教育部重点实验室、重庆大学光电工程学院光电技术及系统教育部重点实验室 |
| 更多格式 | 高清、无水印(增值服务) |
查看“Table 3 Measured concentration and relative error in 18th, 19th, 21th of May”的人还看了
-

- 表3 各因素关联系数及关联度Table 3Relation coefficient and relation degree of various factors of the 18 specimens
-

- Table 1–Effect of different concentrations of propranolol on zeta potential and particle size of the nanoparticles (mean
-

- Table 6 The relative error norm and CPU time of the DSEFG and IEFG methods under different node distributions


