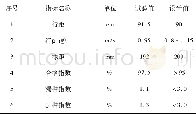
《表3 提取率的实验测量值与软件模拟值对比Table 3 Comparison of the standard values and the soft-measurement values》
 提示:宽带有限、当前游客访问压缩模式
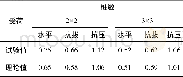
软测量仪表的预测值和紫外分光读法实际值如表3,对应的变化趋势及拟合情况如图6所示。由式(8)对表3中紫外分光度法计算得到的提取率值(η1)和在线测量系统上读取的提取率值(η2)进行计算,得到软测量方法的平均相对误差为4.33%。从表3和图6中可以看出,本文设计的软测量系统能较好地跟踪葛根素提取过程中的变化趋势,具有较高的预测精度。
| 图表编号 | XD002733000 严禁用于非法目的 |
|---|---|
| 绘制时间 | 2018.05.20 |
| 作者 | 吕波特、陈娟、王齐、董翠英、刘博研 |
| 绘制单位 | 北京化工大学信息科学与技术学院、北京化工大学信息科学与技术学院、北京世纪隆博科技有限责任公司、北京化工大学信息科学与技术学院、北京化工大学信息科学与技术学院 |
| 更多格式 | 高清、无水印(增值服务) |