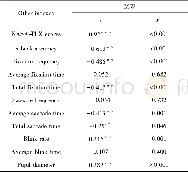
《Table 6 Correlation between MW and n-back accuracy, NASA-TLX scores, Physiological indexes》
 提示:宽带有限、当前游客访问压缩模式
本系列图表出处文件名:随高清版一同展现
《Comprehensive Assessment of Pilot Mental Workload in Various Levels》
*Correlation is significant at the 0.05 level(2-tailed);**Correlation is significant at the 0.01 level(2-tailed).
As show n in Table 6,as expected,the NASA-TLX sores w ere significantly correlated w ith M WL(r=0.92,P<0.001).Here we made a hypothesis that w e quantify M WL as linear number 0,1,2 and3.And then a linear regression analysis w as carried out w ith NASA-TLX scores as the independent variable and M W as the dependent variable.The results show ed that NASA-TLX scale can predict84.3%of the M WLs w ith a good model fit(F (1,46)=252.721,P<0.001) .Performance index w as negative correlated w ith M WL,further regression analysis indicated the N-back accuracy can only predict 35.8%of the M WL w ith a good model fit(F (1,46)=27.257,P<0.001) .
| 图表编号 | XD0024933000 严禁用于非法目的 |
|---|---|
| 绘制时间 | 2018.04.01 |
| 作者 | Kun Yang、Cuanyan Feng、Jie Bai |
| 绘制单位 | Key Laboratory of Civil Aircraft Airworthiness and Maintenance,Civil Aviation University of China、Key Laboratory of Civil Aircraft Airworthiness and Maintenance,Civil Aviation University of China、School of Aeronautic Science and Engineering,Beihang Univer |
| 更多格式 | 高清、无水印(增值服务) |
查看“Table 6 Correlation between MW and n-back accuracy, NASA-TLX scores, Physiological indexes”的人还看了
-

- Table 6 The correlation coefficient values between temperature extremes in CA and atmospheric circulations


