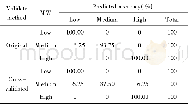
《Table 9 Pre diction re sults of MW in diffe re nt le ve ls》
 提示:宽带有限、当前游客访问压缩模式
本系列图表出处文件名:随高清版一同展现
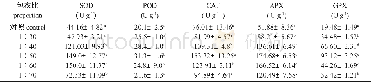
《Comprehensive Assessment of Pilot Mental Workload in Various Levels》
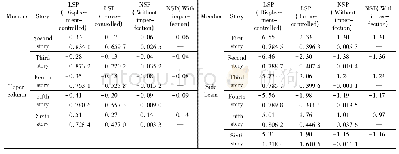
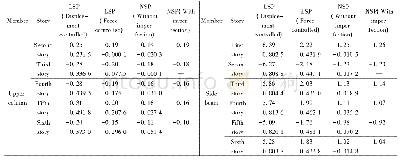
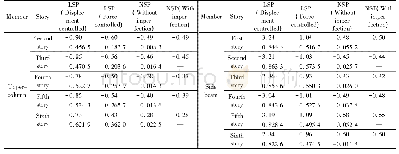
As show n in Table 9,the average discrimination and prediction accuracy of original check method and cross check method w ere 97.92%and 95.83%respectively.Specifically,thediscrimination accuracies betw een low M WL and other M WLs w ere both 100%;the discrimination accuracies betw een medium M WL and other M WLs w ere 93.75%and87.50%respectively;the discrimination accuracies betw een high M WL and other M WLs w ere both100%.Only one of the medium M W group w as misclassified as low M W group in the original validation;tw o samples of medium M W group w as misclassified in the cross validation,one w as misclassified as low M W group and the other one w as classified as high M W group.And w e can infer that the Bayes discriminate results w ere the same as the single Fisher function 1.
| 图表编号 | XD0024932900 严禁用于非法目的 |
|---|---|
| 绘制时间 | 2018.04.01 |
| 作者 | Kun Yang、Cuanyan Feng、Jie Bai |
| 绘制单位 | Key Laboratory of Civil Aircraft Airworthiness and Maintenance,Civil Aviation University of China、Key Laboratory of Civil Aircraft Airworthiness and Maintenance,Civil Aviation University of China、School of Aeronautic Science and Engineering,Beihang Univer |
| 更多格式 | 高清、无水印(增值服务) |