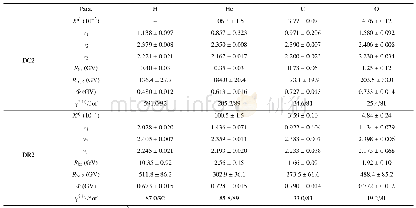
《Table 1 The parameters of fitting different relaxation processes in Arrhenius plot (Fig.5)》
 提示:宽带有限、当前游客访问压缩模式
本系列图表出处文件名:随高清版一同展现
《"Changes of the Molecular Mobility of Poly(ε-caprolactone) upon Drawing,Studied by Dielectric Relaxation Spectroscopy"》
The dielectric loss spectra have been interpreted with three processes,namelyα,β,andγ,each represented by a Cole-Cole term.As known,the temperature dependence of theβandγprocesses follows the Arrhenius law(Eq.1).As described previously,theγpeak shifts to higher frequency as the temperature increases,and even shifts out of the measured frequency window above a certain temperature.However,the left wing of the peak then still contributes to the dielectric loss spectrum in the measuring range.So the fitting procedure started from the lowest measured temperature at which the dielectric loss spectrum shows clearβand/orγrelaxations.Based on the fitting parameters obtained at low temperatures,traces of theβandγrelaxation modes in the low temperature range in the Arrhenius plot can be obtained.According to the Arrhenius law,the positions of theβandγpeaks in the high temperature range can be obtained by extrapolation.For e.g.the undrawn sample,in the temperature range from-120°C to-50°C,there are onlyβandγpeaks in the measured frequency window.As the temperature increases,theαprocess appears at around-60°C.From this temperature upwards,there are three peaks within the measured frequency window,corresponding to theα,β,andγrelaxations.The characteristic frequencies are plotted against inversed temperature in Fig.5.Theαrelaxation process shifts to higher temperature/lower frequency as the draw ratio increases.This trend is the same as found for the apparent peak positions plotted in Fig.3.Furthermore,in the case of theαtrace for theλ=8 sample,there is a decrease(i.e.less negative)of the slope below about 1 rad/s.Even though theβrelaxations appear hidden by theγprocess in the spectra,the CC fitting procedure is capable of revealing its parameters.The slope in the Arrhenius plot of theβline for the drawn samples is slightly larger(less negative)as compared to that for the undrawn sample.This indicates a small decrease of the activation energy of theβrelaxation process upon drawing.Theγtrace in Fig.5 is similar to that in Fig.3.As described in the introduction section,the peak position corresponding to theαrelaxation processes follows the VFT equation,and theβandγrelaxation modes follow the Arrhenius law.As forαrelaxation process,a set of parameters were input initially,then the standard deviation between the experimental data and fitting data was minimized by modifying the pre-input parameters.At least five sets of initial parameters were input for each VFT fitting.For all investigated draw ratios the parameters of the VFT equation and the Arrhenius equations are listed in Table 1.The activation energies of theβandγprocesses do not change significantly upon increasing draw ratio,while the VFT parameter A for theαprocess shows a significant increase upon drawing,especially for the highest drawing ratio.The Vogel temperature decreases upon increasing draw ratio.
| 图表编号 | XD0020169900 严禁用于非法目的 |
|---|---|
| 绘制时间 | 2018.05.01 |
| 作者 | Xiao-Yan Yang、Shao-Shuai Liu、AlexANDer V.Korobko、Stephen J.Picken、Nicolaas A.M.Besseling |
| 绘制单位 | Lucky Research Institute, China Lucky Group Corporation、Lucky Research Institute, China Lucky Group Corporation、Department of Chemical Engineering, Delft University of Technology, 2628 BL Delft, and Dutch Polymer Institute(DPI)、Department of Chemical Engi |
| 更多格式 | 高清、无水印(增值服务) |


