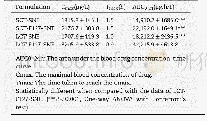
《Table 3–The main pharmacokinetic parameters of CTN after oral administration of the optimized CTN-S
 提示:宽带有限、当前游客访问压缩模式
本系列图表出处文件名:随高清版一同展现
《Development of cryptotanshinone-loaded pellets for angina chronotherapy:In vitro/in vivo prediction and evaluation》
Pharmacokinetics in rats was investigated to verify whether the CTN-SRPs optimized based on deconvolution had a desirable plasma drug concentration-time profile.As shown in Fig.3,the plasma concentration-time curve of CTN-SRPs was similar with the simulated mean predicted one.The percent prediction error(%PE)value of CTN plasma concentration at each time point was calculated according to equation%PE=(observed value-predicted value)/observed value×100%[26].The%PE values from 4 to 16 h were smaller than 15%and the%PE values from 8 to 12 h were smaller than10%.These%PE values demonstrated that the actual observed plasma concentration values were very close to the predicted concentration data calculated and simulated according to the incidence of variant angina during 24 h.These results further indicated that the optimized CTN sustained-release formulation succeeded in achieving highest blood concentrations for maximal protection during the time period when angina pectoris is of greatest risk and occurrence.In addition,the pharmacokinetic parameters(C max,T max,MRT,AUC 0–t and AUC 0–∞)of the optimized CTN-SRPs were calculated and compared with the predicted values in Table 3.These almost equivalent values further validate that the in vivo performance of these CTN-SRPs after oral administration was in accordance with the expected one.
| 图表编号 | XD00186269400 严禁用于非法目的 |
|---|---|
| 绘制时间 | 2018.07.01 |
| 作者 | Zhenghua Li、Shuangshuang Zhang、Hongxiang Yan、Jianping Liu |
| 绘制单位 | Department of Pharmaceutics,China Pharmaceutical University、Department of Pharmaceutics,China Pharmaceutical University、Department of Pharmaceutics,China Pharmaceutical University、Department of Pharmaceutics,China Pharmaceutical University |
| 更多格式 | 高清、无水印(增值服务) |
查看“Table 3–The main pharmacokinetic parameters of CTN after oral administration of the optimized CTN-SRPs in rats (n=6) in”的人还看了
-

- Table 5–Pharmacokinetic parameters of azithromycin in rats after oral administration of AM-containing RMs and Zithromax.
-

- Table 1–The pharmacokinetic parameters of TMP in joint tissue and synovial fluid after intra-articular injection of TMP


