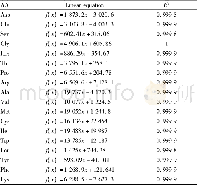
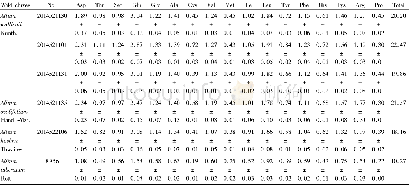
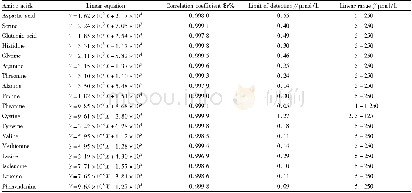
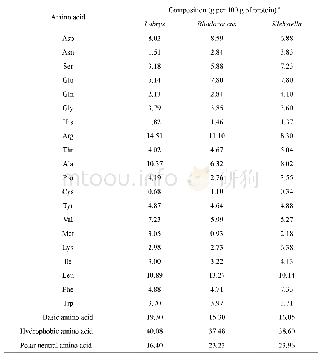
《Table 1 Standard curves of 18 amino acids and corresponding correla-tion coefficients》
 提示:宽带有限、当前游客访问压缩模式
本系列图表出处文件名:随高清版一同展现
《Determination of Content of Amino Acid in Abalone by Precolumn Derivatization and its Nutritional Value Evaluation》
At first,25,50,125,250 and 500 mg/L mixed standard solutions of the 18 amino acids were prepared,and 1 ml of each solution was accurately added into an ampoule bottle and prepared into a testing solution according to the derivatization conditions.The obtained solutions were analyzed sequentially under set conditions.Standard curves were plotted with peak area as f(x)value and detection concentration(mg/L)as x value,and the obtained regression equations and correlation coefficients are shown in Table 1.
| 图表编号 | XD00183048900 严禁用于非法目的 |
|---|---|
| 绘制时间 | 2018.06.01 |
| 作者 | Wen CHEN、Xiangjun WANG、Yujie WANG、Yuzhi HUANG、Fanmeng MENG、Hui CHEN |
| 绘制单位 | School of ocean science and technology,Hainan Tropic Ocean University、Hainan Marine food engineering technology research center、School of life science and ecology,Hainan Tropic Ocean University、School of ocean science and technology,Hainan Tropic Ocean Un |
| 更多格式 | 高清、无水印(增值服务) |


