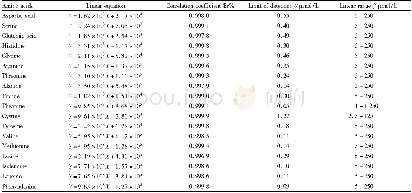
《Table 1 Linear equation, correlation coefficient and limit of detection of 18 kinds of amino acids》
 提示:宽带有限、当前游客访问压缩模式
本系列图表出处文件名:随高清版一同展现
《Determination of 18 Kinds of Amino Acids in Fresh Tea Leaves by HPLC Coupled with Pre-column Derivatization》
We prepared the amino acid mixed standard solution at concentration of 5,10,50,100,200 and 250μmol/L respectively.After derivatization,we measured the samples.Taking the amino acid solution concentration(X)as the abscissa and the corresponding peak area(Y)as the coordinate,we plotted the standard working curve and calculated the correlation coefficient.The results showed that in the range of 5-250μmol/L,the linear relationship between amino acid concentration and its peak area was good,and the correlation coefficient was 0.997 8-0.999 9.At the 3 times the signal to noise ratio,we calculated the limit of detection of the method.The results are shown in Table 1.
| 图表编号 | XD00182561100 严禁用于非法目的 |
|---|---|
| 绘制时间 | 2018.02.01 |
| 作者 | Shangwen DONG、Tengfei LIU、Minghui DONG |
| 绘制单位 | Suzhou No.10 High School of Jiangsu Province、Suzhou Academy of Agricultural Sciences、Suzhou Academy of Agricultural Sciences |
| 更多格式 | 高清、无水印(增值服务) |


