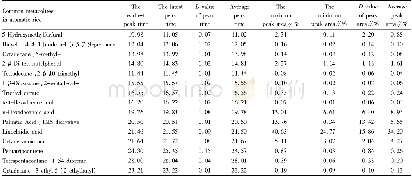
《Table 3 Analysis of peak time and peak area percentage of 15 common metabolites in different aromat
 提示:宽带有限、当前游客访问压缩模式
本系列图表出处文件名:随高清版一同展现
《A Method for Detection of Main Metabolites in Aromatic Rice Seeds》
The peak time of various metabolites varied significantly among different aromatic rice varieties.As shown in Fig.1,the abscissa indicated the retention time of metabolites and the ordinate indicated the response value(peak height,i.e.,relative abundance).Different peak time represented various metabolites.Different peak heights suggested different relative contents of the corresponding metabolites.Specifically,a higher peak indicated a higher relative content of the corresponding metabolite in aromatic rice seeds.When the corresponding retention time of the peak was20.51 min,the system suggested that the metabolite was palmitic acid;at 21.50 min,the peak was larger,and the corresponding metabolite was linoelaidic acid.Peak height and peak area could represent the relative content of the corresponding metabolite in aromatic rice seeds to some extent.In seeds of nine different aromatic rice varieties,the peak time of most metabolites was 7-28min,but the peak time of metabolites with higher relative contents was mainly concentrated within 19-28 min(Table 3,Fig.1),indicating that there were more corresponding metabolites within this period.
| 图表编号 | XD00183016900 严禁用于非法目的 |
|---|---|
| 绘制时间 | 2018.02.01 |
| 作者 | Bo PENG、Dongyan KONG、Xiaohua SONG、Huilong LI、Lulu HE、Andong GONG、Yanfang SUN、Ruihua PANG、Lin LIU、Jintao LI、Qiying ZHOU、Yaqin HUANG、Bin DUAN、Shizhi SONG、Hongyu YUAN |
| 绘制单位 | College of Life Sciences,Xinyang Normal University、Institute for Conservation and Utilization of Agro-bioresources in Dabie Mountains,Xinyang Normal University、College of Life Sciences,Xinyang Normal University、Institute for Conservation and Utilization o |
| 更多格式 | 高清、无水印(增值服务) |
查看“Table 3 Analysis of peak time and peak area percentage of 15 common metabolites in different aromatic rice varieties”的人还看了
-

- 表3 14批样品的15个共有峰峰面积占色谱峰总面积的百分比Tab 3 Percentage of 15 common peaks area to total chromatographic peaks area in HPLC finger


