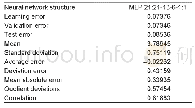
《Table 3.The partition-specific substitution model.》
 提示:宽带有限、当前游客访问压缩模式
本系列图表出处文件名:随高清版一同展现
《Mitochondrial genomes of four pierid butterfly species(Lepidoptera: Pieridae) with assessments about Pieridae phylogeny upon multiple mitogenomic datasets》
The A+T-rich regions of the four mitogenomes are 361,387,362,and 374 bp,respectively,all located between the sr RNA and t RNAMet(Table 2).The A+T contents of these regions are 91.4%,95.0%,90.9%,and 92.7%,respectively,with their values being the highest among all the mitogenomic genes and noncoding sequences(Fig.1,Table 2).The case of significantly strong A+T bias of this region in pierids ranging from the Pieris melete(88.0%)to Catopsilia pomona(97.1%)is commonly found in other lepidopterans(Li et al.,2015).Additionally,these regions of the four mitogenomes also harbor some structures characteristic of lepidopterans(Cao et al.,2016),such as a poly-T stretch upstream of the motif ATAGA,the microsatellite-like elements(TA)n(n=6–10)preceded by the ATTTA motif,etc.(Fig.14).
| 图表编号 | XD0016211200 严禁用于非法目的 |
|---|---|
| 绘制时间 | 2018.10.01 |
| 作者 | Lan Nie、Yunliang Wang、Dunyuan Huang、Ruisong Tao、Chengyong Su、Jiasheng Hao、Chaodong Zhu |
| 绘制单位 | Laboratory of Molecular Evolution and Biodiversity, College of Life Sciences, Anhui Normal University、Laboratory of Molecular Evolution and Biodiversity, College of Life Sciences, Anhui Normal University、College of Life Sciences, Chongqing Normal Universi |
| 更多格式 | 高清、无水印(增值服务) |
查看“Table 3.The partition-specific substitution model.”的人还看了
-

- 表3 特征波长下茶园土壤酸碱状况的Bayes判别模型识别结果Table 3 The predicted results of Bayes discrimination model based on characteristic wavele


