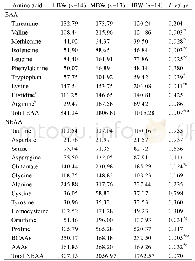
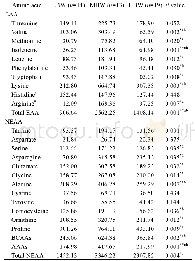
《Table 2.Statistical comparisons among the vertical cross sections of PRGR data (Fig.10d) , TRMM PR
 提示:宽带有限、当前游客访问压缩模式
本系列图表出处文件名:随高清版一同展现
《Three-dimensional Fusion of Spaceborne and Ground Radar Reflectivity Data Using a Neural Network–Based Approach》
Statistical comparisons of reflectivity data in Fig.8 are shown in Table 1,where correlation coefficients(Corr.Coeff),mean errors(Mean)and root-mean-square errors(RM-SEs)between TRMM PR data and GR,fused PRGR data and TRMM PR,and fused PRGR data and GR,are compared.The data pairs selected in the comparisons are in the area where both TRMM PR and GR data are available;hence,PRGR data used are mainly data with NN fusion,and Table1 mainly quantitatively reflects the performance of the fused product with the NN fusion method.For matching to GR and PRGR data,the TRMM PR data used are the upsampled data in the horizontal direction with the nearest neighborhood method.The results in Table 1 show that the generated PRGR data at horizontal planes are more correlated to GR,showing a high correlation coefficient,which means that the horizontal structure of PRGR is more similar to that of GR.The mean error and RMSE of PRGR to TRMM PR is much smaller than that of the original GR to TRMM PR,which indicates the magnitude of PRGR with NN fusion incorporates the characteristics of TRMM PR.
| 图表编号 | XD0015819100 严禁用于非法目的 |
|---|---|
| 绘制时间 | 2018.03.10 |
| 作者 | Leilei KOU、Zhuihui WANG、Fen XU |
| 绘制单位 | Key Laboratory of Meteorological Disaster, Ministry of Education、Joint International Research Laboratory of Climate and Environment Change、Collaborative Innovation Center on Forecast and Evaluation of Meteorological Disasters,Nanjing University of Informa |
| 更多格式 | 高清、无水印(增值服务) |
查看“Table 2.Statistical comparisons among the vertical cross sections of PRGR data (Fig.10d) , TRMM PR (Fig.10c) , and GR da”的人还看了
-

- Table 3 Comparison of essential parameters among the MEMS ring probe, I2 probe and the cantilever probes produced by Oly
-

- Table 3 The growth and yield comparison among the new Spanish olive varieties from Wudu Dabao new Olea europaea variety
-

- 表1 过风景区路段主要技术经济指标Tab.1 The main economic and technical indicators of the crossing scenic area section


