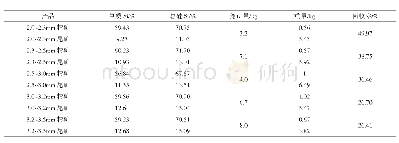
《Table 3 Analysis of experimental results》
 提示:宽带有限、当前游客访问压缩模式
本系列图表出处文件名:随高清版一同展现
《Description and Classification of Leather Defects Based on Principal Component Analysis》
The experimental results can be seen in Table 3,w ith an accuracy rate of 90%,and the processing speed of the experimental single picture is as high as 2 s.This results meet the experimental requirements.
| 图表编号 | XD0014952400 严禁用于非法目的 |
|---|---|
| 绘制时间 | 2018.12.31 |
| 作者 | 丁彩红、黄浩、杨延竹 |
| 绘制单位 | College of Mechanical Engineering,Donghua University、College of Mechanical Engineering,Donghua University、College of Mechanical Engineering,Donghua University |
| 更多格式 | 高清、无水印(增值服务) |


