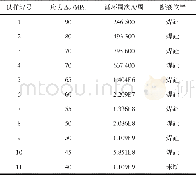
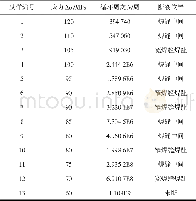
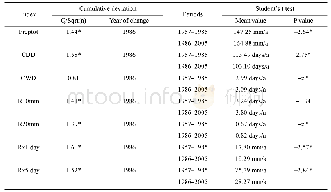
《Table 3 Cumulative fatigue damage results》
 提示:宽带有限、当前游客访问压缩模式
本系列图表出处文件名:随高清版一同展现
《Fatigue Life Prediction of the Metro Bolster Beam under Complex Operating Conditions》
According to the S-N curve,the load amplitude is 80 M Pa w hen the number of load cycles is 107.Thus,the material’s fatigue limit is 80 M Pa or dangerous points w ith stresses more than 80 M Pa,the dangerous points 7 and 8 exhibit the larger proportion than other points.The fatigue life is calculated at the dangerous points 7 and 8,and the smaller value is considered the fatigue life.Table 3 show s the cumulative fatigue damage results of the dangerous points 7 and 8.Since the fatigue life of the dangerous point 7 is smaller than that of the dangerous point8,it is considered as the fatigue life.Therefore,the fatigue life of the bolster beam based on the von M ises equivalent stress method is 18.97 y.
| 图表编号 | XD0014947300 严禁用于非法目的 |
|---|---|
| 绘制时间 | 2018.04.30 |
| 作者 | 尹刚强、王雷、罗宇辉 |
| 绘制单位 | School of Mechanical Engineering and Automation,Northeastern University、School of Mechanical Engineering and Automation,Northeastern University、School of Mechanical Engineering and Automation,Northeastern University |
| 更多格式 | 高清、无水印(增值服务) |


