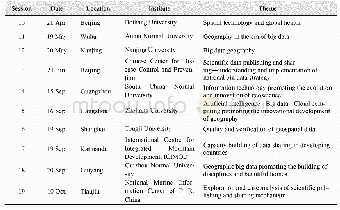
《Table 3 Statistics of damaged buildings》
 提示:宽带有限、当前游客访问压缩模式
本系列图表出处文件名:随高清版一同展现
《海地地震(2010)遥感分析速报联合国数据集的研发》
Figure 9 shows the interpreted result of refugee camps in Port-Au-Prince of Haiti.As shown in Table 4,totally 624 damaged buildings were interpreted with the area about 691,623.44m2(Figure 9,Table 4).
| 图表编号 | XD0027616800 严禁用于非法目的 |
|---|---|
| 绘制时间 | 2017.06.29 |
| 作者 | 刘闯、郭华东、吕婷婷、王晋年、刘定生、王世新、顾行发、曲国胜 |
| 绘制单位 | 中国科学院地理科学与资源研究所、中国科学院遥感与数字地球研究所、中国科学院遥感与数字地球研究所、中国科学院遥感与数字地球研究所、中国科学院遥感与数字地球研究所、中国科学院遥感与数字地球研究所、中国科学院遥感与数字地球研究所、中国地震应急搜救中心 |
| 更多格式 | 高清、无水印(增值服务) |


