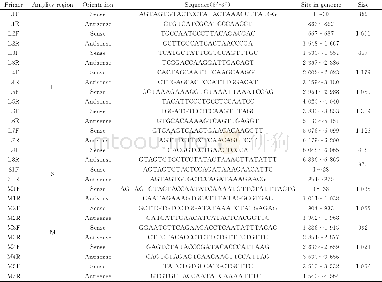
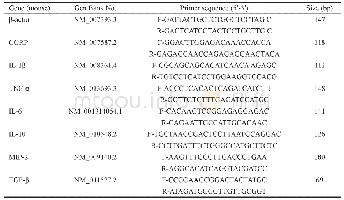
《Table 1 Sequence of primers》
 提示:宽带有限、当前游客访问压缩模式
本系列图表出处文件名:随高清版一同展现
《Evaluated Characteritics of Chicken Bone Marrow-derived Dendritic Cells Following LPS Induced Maturation》
The total RNA was extracted using a commercial kit according to the manufacturer's protocol(Omega BioTek).The total RNA was reverse transcribed into c DNA using Super ScriptⅡreverse transcriptase and oligo(d T)primers(life technologies)according to the manufacturer's recommendations.Cytokine and chemokine m RNA levels were quantified using q RT-PCR,the primer sequences with corresponding Gen Bank primer database are shown in Table 1.The fluorescence of SYBR green dye was measured for every cycle at the end of extension.The dissociation of the amplified product was analyzed at the end of PCR.Chickenβ-actin gene as the reference gene,the relative expression of each target gene was calculated and normalized to that ofβ-actin using ABI 7500 system SDS software(Applied Biosystems).The following PCR conditions were utilized:95℃for 10 min,followed by 40 cycles of 95℃for 15 s and 60℃for1 min.
| 图表编号 | XD0014157600 严禁用于非法目的 |
|---|---|
| 绘制时间 | 2018.09.25 |
| 作者 | Huang Xue-wei、Ma Sun-ting、Xu Yi-gang、Jiang Yan-ping、Cui Wen、Wang Li、Tang Li-jie、Li Yi-jing |
| 绘制单位 | College of Veterinary Medicine, Northeast Agricultural University、College of Veterinary Medicine, Northeast Agricultural University、College of Veterinary Medicine, Northeast Agricultural University、College of Veterinary Medicine, Northeast Agricultural Un |
| 更多格式 | 高清、无水印(增值服务) |


