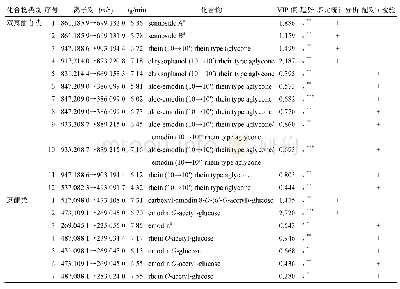
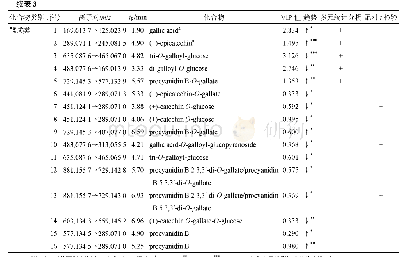
《表3 统计学分析(相关性、T-检验和显著性)》
 提示:宽带有限、当前游客访问压缩模式
本系列图表出处文件名:随高清版一同展现
《响应面法优化阿维链霉菌生产多拉菌素的培养基(英文)》
To move rapidly towards the neighborhood of the optimum response,we used the steepest ascent path.The experiments were adopted to determine a suitable direction by increasing or decreasing the concentrations of variables according to the results of PBD[16].Level of the variables was shown in Tab.4.
| 图表编号 | XD0098921900 严禁用于非法目的 |
|---|---|
| 绘制时间 | 2019.09.25 |
| 作者 | 杨世红、韩伟、张晓琳 |
| 绘制单位 | 国家粮食局科学研究院、武汉轻工大学、国家粮食局科学研究院、武汉轻工大学、国家粮食局科学研究院 |
| 更多格式 | 高清、无水印(增值服务) |


