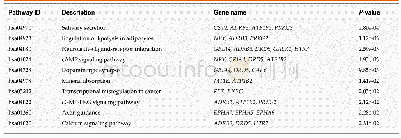
《Table 4Results from metabolic pathway analysis with Metabo Analyst 3.0.a》
 提示:宽带有限、当前游客访问压缩模式
本系列图表出处文件名:随高清版一同展现
《Inhibition of metabolic disorders in vivo and in vitro by main constituent of Coreopsis tinctoria》
aTotal is total number of compounds in pathway;Hits are actually matched number from user uploaded data;Raw p is original p-value calculated from enrichment analysis;FDR(False Discovery Rate)is also from enrichment analysis;Impact is pathway impact value
Cells treated with high glucose or marein were collected to isolate the total RNA.Total RNA was reverse transcribed,and PEPCK,G6Pase,FH,MDH2,SDHA,SDHB,IDH2,ACO2,CS,and glyceraldehyde-3-phosphate dehydrogenase(GAPDH)gene expression was measured by q PCR using an i Cycler thermocycler(Bio Rad,Hercules,CA)as previously described(Mac Donald et al.,2013).The primers for these genes were listed in Table 1.All samples were analyzed in triplicate,and the gene expression levels were normalized to the control human GAPDH values.The relative expression of the treated samples was normalized to that of the untreated cells according to the Ct analysis.
| 图表编号 | XD007994000 严禁用于非法目的 |
|---|---|
| 绘制时间 | 2018.04.18 |
| 作者 | Bao-ping Jiang、Qiu-yue Lv、Jia-mei Xiang、Liang Le、Ke-ping Hu、Li-jia Xu、Pei-gen Xiao |
| 绘制单位 | Institute of Medicinal Plant Development, Chinese Academy of Medical Sciences and Peking Union Medical College、Institute of Medicinal Plant Development, Chinese Academy of Medical Sciences and Peking Union Medical College、Institute of Medicinal Plant Deve |
| 更多格式 | 高清、无水印(增值服务) |

