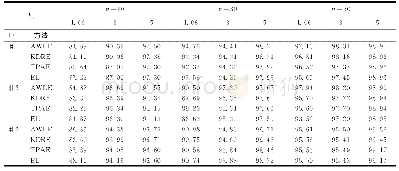
《Table 4Odds ratios and 95%confidence interval of associated NAFLD with metabolic syndrome in non-ob
 提示:宽带有限、当前游客访问压缩模式
本系列图表出处文件名:随高清版一同展现
《Risk factors and metabolic abnormality of patients with non-alcoholic fatty liver disease: Either non-obese or obese Chinese population》
Analyzed with multivariate Cox’s regression.#:adjustment for age and gender;Met S:metabolic syndrome;OR:odds ratio;CI:confidence interval.
Of the 2008 enrolled subjects in our study,745(37.1%),208(10.4%),770(38.3%)and 285(14.2%)were categorized into the groups of non-obese normal liver(group A),non-obese NAFLD(group B),obese normal liver(group C)and obese NAFLD(group D),respectively.The patient’s characteristics have been summarized in Table 1.The mean ages were similar among the four groups.Male predominance was significant in the group B when compared with the group A(49.0%vs.40.8%,P=0.03).The individuals in the group B had a significant higher BMI,waist circumference,cholesterol,triglyceride,glucose and ALT,than those in the group A(P=0.01).Similarly,the subjects in the group D possessed significantly higher triglyceride,glucose and ALT than those in the group C.However,the difference in values of BMI,waist circumference and cholesterol were not significant between these two groups.For the individuals with NAFLD,there were no differences in cholesterol,triglyceride,glucose and ALT between group B and D.The highest ratio of metabolic syndrome existed in group B(26.9%),followed by group A(11.7%),group D(10.9%)and finally group C(5.2%).These differences were significant(P=0.01).
| 图表编号 | XD0020448300 严禁用于非法目的 |
|---|---|
| 绘制时间 | 2018.02.01 |
| 作者 | Shou-Wu Lee、Teng-Yu Lee、Sheng-Shun Yang、Chun-Fang Tung、Hong-Zen Yeh、Chi-Sen Chang |
| 绘制单位 | Division of Gastroenterology, Department of Internal Medicine, Taichung Veterans General Hospital、Division of Gastroenterology, Department of Internal Medicine, Taichung Veterans General Hospital、Division of Gastroenterology, Department of Internal Medici |
| 更多格式 | 高清、无水印(增值服务) |
查看“Table 4Odds ratios and 95%confidence interval of associated NAFLD with metabolic syndrome in non-obese and obese individ”的人还看了
-

- 表2 拟合曲线参数、95%置信区间估计及显著性检验结果Tab.2 Parameters of the fitted model, 95%confidence interval and results of significant hypot


