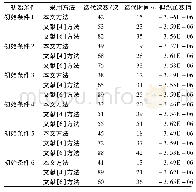
《表4 变量Ω功率密度谱的尖频峰值频率》
whereωx’is local streamwise vorticity fluctuations,s is the coordinate of the line away from the airfoil surface.The length of 0.2c is selected to ensure the boundary layers are included.The peak frequencies in the PSD ofΩare denoted by fΩ,which are in Table 4.It finds that fΩagree well with fnlisted in Table 3for all simulated cases.Especially for the R5A2and R5A4case,fΩon the suction side and the pressure side of the airfoil are not identical but respectively equal fnin the second and first hump in the acoustic spectra as displayed in Figure 4.It further confirms that the vortex shedding on the suction side and the pressure side of the airfoil contributes separately to the generation of sound waves.Above analysis demonstrates that the unsteady vorticity variations are accompanied with periodic pressure oscillations near the trailing edge which are observed as discrete tonal noise in the far field.
| 图表编号 | XD0069371500 严禁用于非法目的 |
|---|---|
| 绘制时间 | 2019.06.01 |
| 作者 | 许思为、李伟鹏 |
| 绘制单位 | 上海交通大学航空航天学院、上海交通大学航空航天学院 |
| 更多格式 | 高清、无水印(增值服务) |
 提示:宽带有限、当前游客访问压缩模式
![表2 不同激光峰值功率密度下材料的物理现象[15]](http://bookimg.mtoou.info/tubiao/gif/TYNZ202010006_15700.gif)


