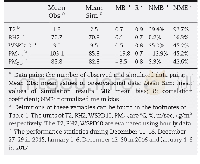
《Table 3–Performance statistics of simulated meteorological conditions and PM2.5concentration in Qin
 提示:宽带有限、当前游客访问压缩模式
本系列图表出处文件名:随高清版一同展现
《Process analysis of PM_(2.5) pollution events in a coastal city of China using CMAQ》
Air pollution events would be contributed by local or long range transport of air pollutants.In order to select the pollution events represented different types(local or long range transport),three emission reduction scenarios were designed to calculate contribution of PM2.5from different regions(Fig.2,Table 2).The contribution of one region to Qingdao was calculated by the equations below:
| 图表编号 | XD0052059800 严禁用于非法目的 |
|---|---|
| 绘制时间 | 2019.05.15 |
| 作者 | Qiang Zhang、Di Xue、Xiaohuan Liu、Xiang Gong、Huiwang Gao |
| 绘制单位 | College of Environmental Science and Engineering, Ocean University of China、College of Environmental Science and Engineering, Ocean University of China、College of Environmental Science and Engineering, Ocean University of China、Key Laboratory of Marine En |
| 更多格式 | 高清、无水印(增值服务) |
查看“Table 3–Performance statistics of simulated meteorological conditions and PM2.5concentration in Qingdao.”的人还看了
-

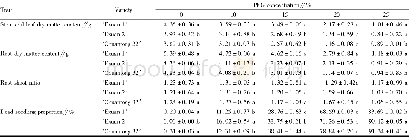
- Table 2 Growth situation of I.polycarpa seedlings under drought stress simulated with different concentrations of PEG


