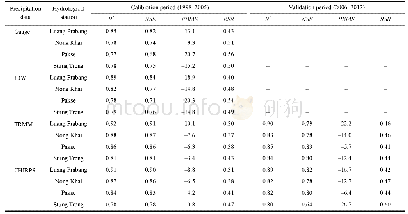
《Table 5 Evaluation statistics of the simulation with CHIRPS data during 1981–1997》
 提示:宽带有限、当前游客访问压缩模式
本系列图表出处文件名:随高清版一同展现
《Hydrological Simulation Using TRMM and CHIRPS Precipitation Estimates in the Lower Lancang-Mekong River Basin》
Note:Meanings of all abbreviations are shown in Table 3
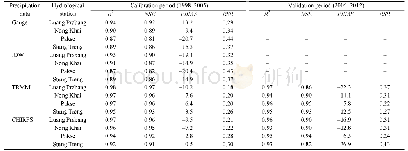
The performances of the gauge-simulation,IDW-simulation,TRMM-simulation,and CHIRPS-simulation were compared further using evaluation statistics at monthly(Table 3)and daily(Table 4)scales.According to the performance classification recommended by Moriasi et al.(2007),at monthly scale,the models with different precipitation inputs all achieved very good performances for NSE and RSR during calibration and validation periods,and mostly very good,good,or satisfactory performances for PBIAS.
| 图表编号 | XD0046955300 严禁用于非法目的 |
|---|---|
| 绘制时间 | 2019.02.01 |
| 作者 | LUO Xian、WU Wenqi、HE Daming、LI Yungang、JI Xuan |
| 绘制单位 | Asian International Rivers Center, Yunnan University、Yunnan Key Laboratory of International Rivers and Transboundary Eco-security、Asian International Rivers Center, Yunnan University、Asian International Rivers Center, Yunnan University、Yunnan Key Laborato |
| 更多格式 | 高清、无水印(增值服务) |
查看“Table 5 Evaluation statistics of the simulation with CHIRPS data during 1981–1997”的人还看了
-

- Table 4 Daily evaluation statistics of gauge-simulation, IDW-simulation, TRMM-simulation, and CHIRPS-simulation


