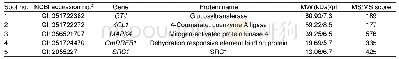
《Table 2 Identification of the differentially expressed spots by mass spectrometry (MS) 1)》
 提示:宽带有限、当前游客访问压缩模式
本系列图表出处文件名:随高清版一同展现
《"GsMAPK4,a positive regulator of soybean tolerance to salinity stress"》
1) MW,molecular weight;pI,protein isoelectric.2) GI,geninfo identifier.
Total RNA was extracted,and the quantitative real-time PCR(qRT-PCR)analysis was performed according to a previous report by Huang Y L et al.(2013).Actin was used as a reference gene in this study.Primer information is shown in Table 1.The qRT-PCR reaction was performed at 95°C for 10 s,followed by 40 cycles at 95°C for 5 s,60°C for 31 s by using the two-step RT-PCR.RT-PCR analysis was performed by the 2–ΔΔCT method(Livak and Schmittgen 2001).
| 图表编号 | XD0047432700 严禁用于非法目的 |
|---|---|
| 绘制时间 | 2019.02.20 |
| 作者 | QIU You-wen、FENG Zhe、FU Ming-ming、YUAN Xiao-han、LUO Chao-chao、YU Yan-bo、FENG Yan-zhong、WEI Qi、LI Feng-lan |
| 绘制单位 | College of Life Science, Northeast Agricultural University、College of Life Science, Northeast Agricultural University、Heilongjiang Institute of Education、College of Life Science, Northeast Agricultural University、College of Life Science, Northeast Agricul |
| 更多格式 | 高清、无水印(增值服务) |


