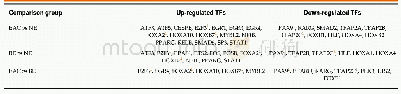
《Table 1 Differentially expressed transcription factors in the comparison groups in the GSE1420 data
 提示:宽带有限、当前游客访问压缩模式
本系列图表出处文件名:随高清版一同展现
《Biomarker identification and trans-regulatory network analyses in esophageal adenocarcinoma and Barrett's esophagus》
1Differentially expressed transcription factors,which displayed the same expression tendency among all the three comparison groups.TF:Transcription factor;EAC:Esophageal adenocarcinoma;NE:Normal esophagus;BE:Barrett's esophagus.
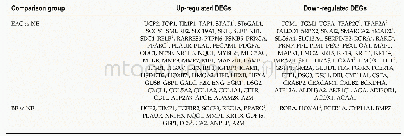
In this study,we first identified DEGs in groups of EAC compared to NE(EAC vs NE),BE compared to NE(BE vs NE),and EAC compared to BE(EAC vs BE)in the GSE1420 dataset.The numbers of DEGs in the three different comparison groups are shown in Figure 1(|FC|>1.5,P-values<0.05).Refer to Supplementary Tables 1-3 for details.
| 图表编号 | XD0049333300 严禁用于非法目的 |
|---|---|
| 绘制时间 | 2019.01.14 |
| 作者 | Jing Lv、Lei Guo、Ji-Han Wang、Yu-Zhu Yan、Jun Zhang、Yang-Yang Wang、Yan Yu、Yun-Fei Huang、He-Ping Zhao |
| 绘制单位 | Department of Clinical Laboratory,Honghui Hospital, Xi’an Jiaotong University、Department of Spinal Surgery, Honghui Hospital, Xi’an Jiaotong University、Department of Clinical Laboratory,Honghui Hospital, Xi’an Jiaotong University、Department of Clinical La |
| 更多格式 | 高清、无水印(增值服务) |


