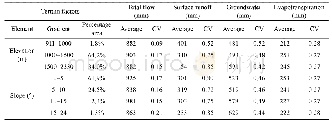
《Table 4 Runoff and evapotranspiration based on different elevations of hydrological response units
 提示:宽带有限、当前游客访问压缩模式
本系列图表出处文件名:随高清版一同展现
《基于SWAT模型模拟乌江三岔河生态系统产流服务及其空间变异(英文)》
Elevation in the Sancha River Basin ranges between 911 and 2330 m.The corresponding average values and coefficients of variation for the total runoff volume,surface runoff,underground runoff,and actual evapotranspiration at elevation gradients of 911–1000 m,1000–1500 m,and 1500–2330 m are obtained.Figure 4 and Table 4 show that variations in the total runoff volume with elevation are small(803–882 mm),and fluctuations in the coefficient of variation are insignificant(0.09–0.21),while surface runoff variations are relatively large.At elevations of 911–1000 m,the surface runoff is 401 mm and the coefficient of variation is 0.52.As the elevation increases,the surface runoff decreases to 154 mm and the coefficient of variation increases to 0.85.The average value of underground runoff gradually increases at higher elevation.The actual evapotranspiration exhibits no difference at different elevation gradients.In general,elevation has significant effects on surface and underground runoff in the Sancha River Basin.The percentage of underground runoff increases with elevation,while that of surface runoff decreases.
| 图表编号 | XD0047168200 严禁用于非法目的 |
|---|---|
| 绘制时间 | 2019.03.01 |
| 作者 | 侯文娟、高江波 |
| 绘制单位 | Key Laboratory of Land Surface Pattern and Simulation, Institute of Geographic Sciences and Natural Resources Research, CAS、Key Laboratory of Land Surface Pattern and Simulation, Institute of Geographic Sciences and Natural Resources Research, CAS |
| 更多格式 | 高清、无水印(增值服务) |
查看“Table 4 Runoff and evapotranspiration based on different elevations of hydrological response units (HRUs) in the Sancha”的人还看了
-

- Table 3 The calibrated values of parameters of GIUH and GcIUH models different rainfall-runoff events


