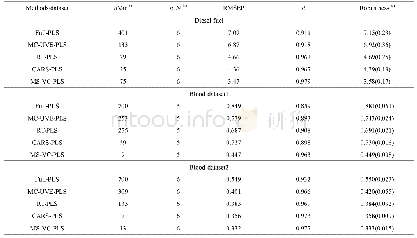
《Table 3 Comparison of the results by different methods for the three datasets》
 提示:宽带有限、当前游客访问压缩模式
本系列图表出处文件名:随高清版一同展现
《A variable importance criterion for variable selection in near-infrared spectral analysis》
a) Number of spectral variables;b) number of latent variables;c) mean value and the standard deviation over 500 independent runs of the robustness test.
To verify the rationality of the C value,five spectral bands with higher(than Q3)and lower(than Q1)C value are investigated.As indicated by the red and blue bars in the figure,the spectral intervals of 1228–1242,1292–1310,1470–1486,1280–1288 and 1490–1550 nm were studied.The former three bands should have positive contributions to the model,and the latter two bands should have negative effects on the model.Taking the full spectra model as a reference,the results obtained by removing the variables in the five spectral intervals are compared in Table 1.
| 图表编号 | XD0034633700 严禁用于非法目的 |
|---|---|
| 绘制时间 | 2019.02.01 |
| 作者 | Jin Zhang、Xiaoyu Cui、Wensheng Cai、Xueguang Shao |
| 绘制单位 | Research Center for Analytical Sciences, College of Chemistry, Nankai University、Research Center for Analytical Sciences, College of Chemistry, Nankai University、Research Center for Analytical Sciences, College of Chemistry, Nankai University、Research Cen |
| 更多格式 | 高清、无水印(增值服务) |
查看“Table 3 Comparison of the results by different methods for the three datasets”的人还看了
-

- Table 4–Comparison of different three-band fitting methods for spectrum from the diesel soot measured using 0.1 mW laser


