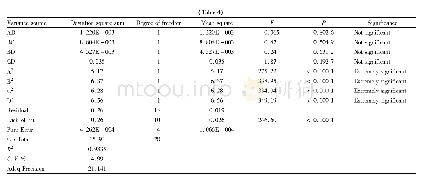
《Table 2–Analysis of variance for BS resistance for significant markers detected by the BSA method i
 提示:宽带有限、当前游客访问压缩模式
本系列图表出处文件名:随高清版一同展现
《Identification of stably expressed QTL for resistance to black shank disease in tobacco(Nicotiana tabacum L.) line Beinhart 1000-1》
aMarker PT61373 and SNPCPS2showed no significant association with resistance to BS in BSA in this study,but the marker was tightly linked with a major QTL for resistance to BS in previous studies.bInformation for SNPCPS2obtained from Sallaud et al.[37].cG
The two major QTL,named q BS7 and q BS17,were repeatedly detected under different conditions in this study(Table 3and Fig.4).The QTL q BS7 was mapped to the region between PT30174 and PT60621,and explained 17.40%–25.60%of the phenotypic variance under different conditions.The allele from BH increased resistance to BS.QTL q BS17 in the interval PT61564–PT61538 in linkage group 17 was detected in BC1F2in the field and in BC1F2:3in both the field and seedling stage tests,and explained 6.90%–11.60%of the phenotypic variance.The allele from XHJ decreased resistance to BS across all environments.
| 图表编号 | XD0012322800 严禁用于非法目的 |
|---|---|
| 绘制时间 | 2018.06.01 |
| 作者 | Yusheng Zhang、Xuan Guo、Xingxing Yan、Min Ren、Caihong Jiang、Yazeng Cheng、Liuying Wen、Dan Liu、Yu Zhang、Mingming Sun、Quanfu Feng、Aiguo Yang、Lirui Cheng |
| 绘制单位 | Key Laboratory of Tobacco Improvement and Biotechnology,Tobacco Research Institute,Chinese Academy of Agricultural Sciences、Key Laboratory of Tobacco Improvement and Biotechnology,Tobacco Research Institute,Chinese Academy of Agricultural Sciences、College |
| 更多格式 | 高清、无水印(增值服务) |


