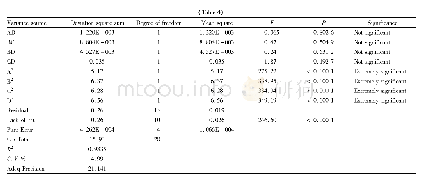
《Table 4 The results of variance analysis and significance analysis of regression model》
 提示:宽带有限、当前游客访问压缩模式
本系列图表出处文件名:随高清版一同展现
《The Optimization of Ultrasonic-assisted Extraction of Polysaccharide from Sipunculus nudus by Response Surface Methodology and Study on Antioxidant Activity》
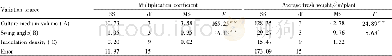
Note:P<0.02:significant difference;P<0.005:highly significant difference;P<0.001:extremely significant difference.
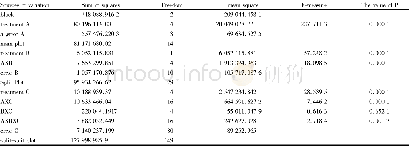
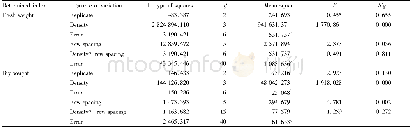
Fitting of response surface test regression equationOn the basis of single factor test results,the extraction conditions of S.nudus polysaccharide were designed using software Design-Expert 8.05 with the extracting rate of S.nudus polysaccharide as response value,and the results are shown in Table 3.
| 图表编号 | XD0028004200 严禁用于非法目的 |
|---|---|
| 绘制时间 | 2019.02.01 |
| 作者 | Wen CHEN、Xiangjun WANG、Yujie WANG、Sihui LIU、Jiahui WEN、Ruzheng CAI、Weiqiang LIU、Liuhuan LI |
| 绘制单位 | School of ocean science and technology,Hainan Tropic Ocean University、School of life science and ecology,Hainan Tropic Ocean University、School of ocean science and technology,Hainan Tropic Ocean University、School of ocean science and technology,Hainan Tro |
| 更多格式 | 高清、无水印(增值服务) |