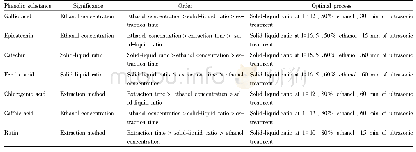
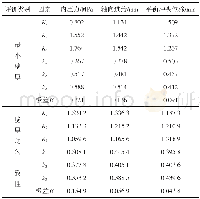
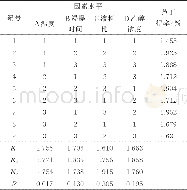
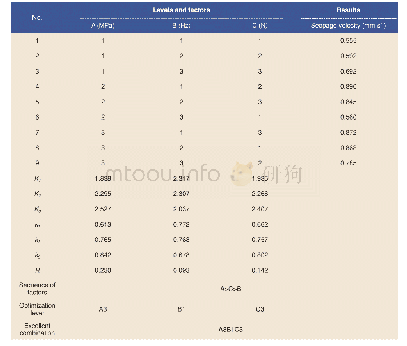
《Table 4 Analysis on results of orthogonal test》
 提示:宽带有限、当前游客访问压缩模式
本系列图表出处文件名:随高清版一同展现
《Determination of Phenolic Substances in Vidal Blanc Grape》
Three factors including material-liquid ratio(A),ethanol concentration(B)and ultrasonic extraction time(C)were selected.Each factor was set at 3 levels.The levels of test factors are shown in Table 1.The experimental schedule is shown in Table 2.The variance analysis is shown in Table 3.The analysis of the orthogonal test is shown in Table 4.
| 图表编号 | XD0028005800 严禁用于非法目的 |
|---|---|
| 绘制时间 | 2019.02.01 |
| 作者 | Yetong LIAO、Donghai CHU |
| 绘制单位 | Liaoning Institute of Science and Technology、Liaoning Institute of Science and Technology |
| 更多格式 | 高清、无水印(增值服务) |


