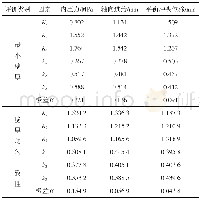
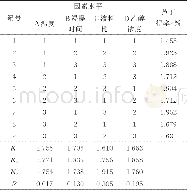
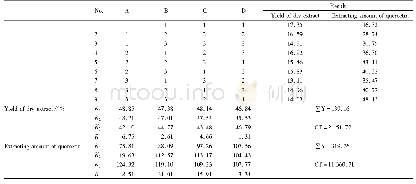
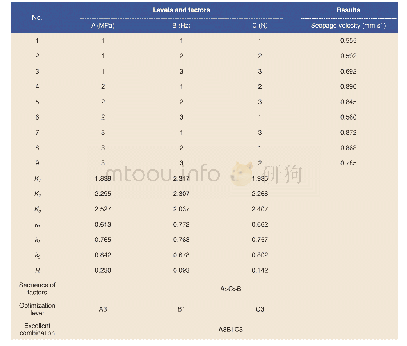
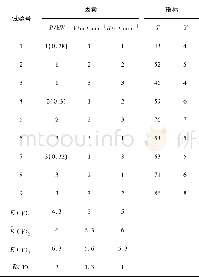
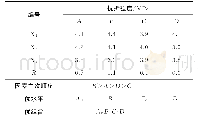
《Table 5 Results and analysis of orthogonal test》
 提示:宽带有限、当前游客访问压缩模式
本系列图表出处文件名:随高清版一同展现
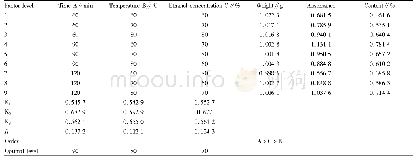
《Extraction Process and Content Determination of Total Flavonoids in Ginkgo( Ginkgo biloba L. ) Leaves》
Standard curve y=0.0721x+0.001 1,R2=0.999 9;percentage content(%)=C×10×50/m×100%,wherein C is the concentration,m is the weight of ginkgo leaves.
At first,0.50,1.00,1.50,2.00,2.50 and 3.00 ml of quercetin standard solution were accurately pipetted into 10 ml volumetric flasks,respectively,followed by diluting to constant volume with methanol and shaking uniformly.The absorbance values of the obtained solutions were determined at 259.5 nm with methanol as a blank reference solution.A standard curve was drawn with the absorbance as the ordinate and the concentration as the abscissa.The concentration and absorbance values are shown in Table 1.The mass concentration of quercetin X(μg/ml)was in good linear relation with the absorbance Y in the range of6.50-39.0μg/ml.The linear regression equation of quercetin concentration X(μg/ml)and absorbance Y was Y=0.034 4X-0.020 1,R2=0.999 9.The linear relation was good.
| 图表编号 | XD0028005000 严禁用于非法目的 |
|---|---|
| 绘制时间 | 2019.02.01 |
| 作者 | Dengfeng ZOU、Hua ZHU、Binghua QIN、Xiaohua WANG |
| 绘制单位 | Guilin Medical University、Guilin Medical University、Guilin Medical University、Guilin Medical University |
| 更多格式 | 高清、无水印(增值服务) |
