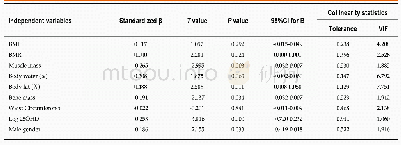
《Table 6 Multiple regression analysis on yield components and yield between treatments of M3 and M4
 提示:宽带有限、当前游客访问压缩模式
本系列图表出处文件名:随高清版一同展现
《"Effects of mulches on water use in a winter wheat/summer maize rotation system in Loess Plateau, China"》
Note:*indicates significant difference at P<0.05 level.
Yield,yield components,WP and PP of the wheat crop were significantly higher in the mulched treatments than those in the control(Table 5),with an average increase in yield of 16.3%and 17.1%in 2013–2014 and 2014–2015,respectively.Grain yield was the highest in M3 at 9281 kg/hm2 in2013–2014 and 9210 kg/hm2 in 2014–2015,followed by M4 at 9105 kg/hm2 in 2013–2014 and9055 kg/hm2 in 2014–2015.Yield components in all treatments were lower in 2014–2015 than those in 2013–2014.None of the yield components exhibited significant differences between M3and M4 in the two seasons,except for numbers of fertile tillers,suggesting that the yield differences between M3 and M4 mainly due to differences in the numbers of fertile tillers(Table 6).
| 图表编号 | XD0020360000 严禁用于非法目的 |
|---|---|
| 绘制时间 | 2018.04.01 |
| 作者 | YIN Minhua、LI Yuannong、XU Yuanbo、ZHOU Changming |
| 绘制单位 | Key Laboratory of Agricultural Soil and Water Engineering in Arid and Semiarid Areas, Ministry of Education, Northwest A&F University、College of Water Resources and Architectural Engineering, Northwest A&F University、Key Laboratory of Agricultural Soil an |
| 更多格式 | 高清、无水印(增值服务) |
查看“Table 6 Multiple regression analysis on yield components and yield between treatments of M3 and M4 in the two winter whe”的人还看了
-

- Table 3 Analysis on yielding ability and stability and adaptability of the test proso millet varieties


