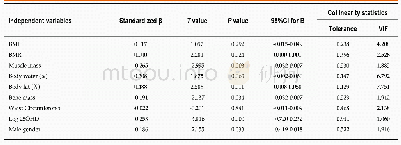
《Table 3 Multiple regression analysis of serum leptin determinants》
 提示:宽带有限、当前游客访问压缩模式
本系列图表出处文件名:随高清版一同展现
《"Are serum leptin levels predicted by lipoproteins, vitamin D and body composition"》
Dependent variable:was log leptin.Univariate analysis was conducted and variables that had significant association with leptin in univariate analysis at P<0.2 were entered in multivariable analysis shown above.Coefficients(r)and P values are calculated u
A total of 167 subjects were enrolled;there was a near equal gender distribution with Female:Male 93:74.No statistically significant difference for age was found between the two genders.None of the subjects studied had any clinical signs of disease associated with obesity and were not on any medications.Of the total seven were cigarette smokers(4.1%);2 smokers were females and the rest were males.Characteristics of the study population are summarized in Table 1.
| 图表编号 | XD0058749200 严禁用于非法目的 |
|---|---|
| 绘制时间 | 2019.04.15 |
| 作者 | Aysha Habib Khan、Syeda Sadia Fatima、Ahmed Raheem、Lena Jafri |
| 绘制单位 | Departments of Pathology and Laboratory Medicine and Medicine, Aga Khan University、Department of Basic Biomedical Sciences, Aga Khan University、Department of Pathology and Laboratory Medicine, Aga Khan University、Department of Pathology and Laboratory Med |
| 更多格式 | 高清、无水印(增值服务) |


