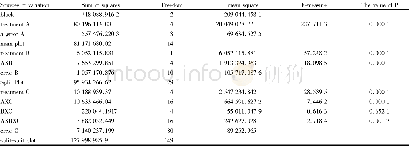
《Table 1–Analysis of variance of yield, yield components, and agronomic and quality traits.》
 提示:宽带有限、当前游客访问压缩模式
本系列图表出处文件名:随高清版一同展现
《Use of genomic selection and breeding simulation in cross prediction for improvement of yield and quality in wheat(Triticum aestivum L.)》
CV,coefficient of variation;VG,estimated variance of genotypic effects;VGE,estimated variance of G×E interactions;NA,data not available.and,significant at the 0.05 and 0.001 probability levels,respectively;ns,non-significant.aHeading date was a
A wheat population was constructed from 48 high quality and three high-yielding cultivars or advanced lines bred in China and six high-quality cultivars from the U.S and Australia.Names and origins of the 57 wheat fixed lines are presented in Supplementary Table S1.For phenotyping,the 57wheat fixed lines were evaluated in two locations:Jining,Shandong province,and Gaoyi,Hebei province in two seasons from 2013 to 2015,using randomized complete block designs.Each trial had two replications,each of 6 rows 4 m in length and 0.2 m in width for each plot.Yield and thousand-kernel weight were evaluated in both seasons.Other yield components and agronomic traits including spike number,kernel number,heading date,and plant height were evaluated in Jining and Gaoyi only in the 2013–2014 season[32].
| 图表编号 | XD0012326800 严禁用于非法目的 |
|---|---|
| 绘制时间 | 2018.08.01 |
| 作者 | Ji Yao、Dehui Zhao、Xinmin Chen、Yong Zhang、Jiankang Wang |
| 绘制单位 | The National Key Facility for Crop Gene Resources and Genetic Improvement, National Wheat Improvement Center, Institute of Crop Sciences,Academy of Agricultural Sciences、The National Key Facility for Crop Gene Resources and Genetic Improvement, National W |
| 更多格式 | 高清、无水印(增值服务) |
查看“Table 1–Analysis of variance of yield, yield components, and agronomic and quality traits.”的人还看了
-

- Table 2 Yield variance analysis results of different test sites, different nitrogen amounts and different ratios of cont


