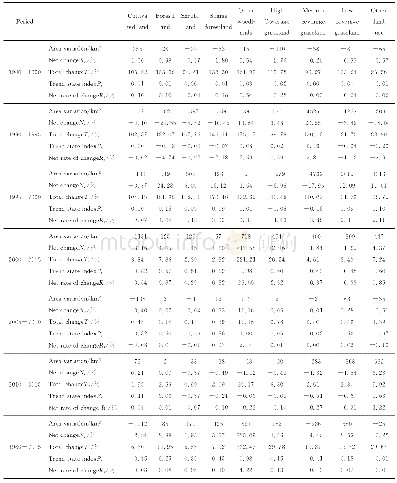
《Table 5 Changes in the regional averaged growing season indices during the period 1961–2015 in nort
 提示:宽带有限、当前游客访问压缩模式
本系列图表出处文件名:随高清版一同展现
《Variations of the thermal growing season during the period 1961–2015 in northern China》
For all 877 stations,the averaged changes in four starting indices of the growing season ranged from–11.3 to–10.1 days during 1961–2015(Table 5).Statistics showed that there were 608,602,586 and 576 stations with significant advancing rates of 1.0–5.5 days per decade for SI 1,SI 2,SI3 and SI 4,accounting for 69.3%,68.6%,66.8%and 65.7%of the total stations across northern China,respectively,of which there were 54.4%,56.0%,56.6%and 56.3%of stations with significant advancing rates of 1.0–3.0 days per decade,respectively.Areas with significant advance of the growing season reduced gradually from SI 1 to SI 4(Fig.5).None of station had significant later onset of the growing season for all four indices.Indices including the frost criteria brought about changes of 1.0 day less than those disregarding frost criteria on average.
| 图表编号 | XD0020359300 严禁用于非法目的 |
|---|---|
| 绘制时间 | 2018.04.01 |
| 作者 | CUI Linli、SHI Jun、MA Yue、LIU Xiaochen |
| 绘制单位 | Shanghai Institute of Meteorological Science,Shanghai Meteorological Bureau、Shanghai Key Laboratory of Meteorology and Health、Shanghai Key Laboratory of Meteorology and Health、Shanghai Climate Center,Shanghai Meteorological Bureau、Shanghai Climate Center, |
| 更多格式 | 高清、无水印(增值服务) |
查看“Table 5 Changes in the regional averaged growing season indices during the period 1961–2015 in northern China”的人还看了
-

- 表2 黄河源区多年平均年、季节蒸发量Table 2 The annual and seasonal average pan evaporations in the source regions of the Yellow River
-

- Table 5 Changes in average productivity of production areas after im-plementation of consolidation projects


