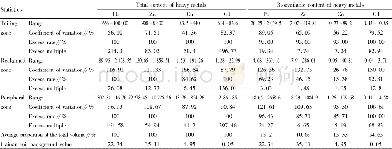
《Table 3 Contents of baicalin in the samples》
 提示:宽带有限、当前游客访问压缩模式
本系列图表出处文件名:随高清版一同展现
《Content Analysis of Baicalin and Heavy Metals in Scutellaria baicalensis Georgi Cultivated in Jizhou District》
As shown in Fig.1,the main peak band of the baicalin standard began to appear at 15'45″.As shown in Fig.2,the main peak band of the test solution also appeared at this time,indicating that the main peak band of the test solution was baicalin.As shown in Table 1,Table 2 and Table 3,the concentration of baicalin in the samples was 44.712 and 44.267 3μg/m L,respectively;the peak height of baicalin in the samples was 51 929 and51 871,respectively;the peak height of the baicalin standard was60 851 and 60 358,respectively;and the peak area of baicalin in the samples was 1 673 757 and 1 657 110,respectively.The relative standard deviation of the data was small,indicating the data had good parallelism and the experiment was more reliable.According to the following calculation formula:
| 图表编号 | XD00182632800 严禁用于非法目的 |
|---|---|
| 绘制时间 | 2018.10.01 |
| 作者 | Chenxi WANG、Yi PEI、Ming YANG、Wen XU、Huiying JIAO、Yaqi QIAO、Jiangli NIE、Ya SU |
| 绘制单位 | Tianjin Agricultural University、Tianjin Agricultural University、Tianjin Agricultural University、Tianjin Agricultural University、Tianjin Agricultural University、Tianjin Agricultural University、Tianjin Agricultural University、Tianjin Agricultural University |
| 更多格式 | 高清、无水印(增值服务) |


