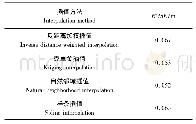
《Table 1.Time-averaged RMSE values of different methods.》
 提示:宽带有限、当前游客访问压缩模式
本系列图表出处文件名:随高清版一同展现
《Data Assimilation Method Based on the Constraints of Confidence Region》
First,the observation error variance is set as Rt=0.12I3,and the value of model error variance is set as Qt=σ12I3,whereσ1is a varying parameter.The results are demonstrated in Table 2.From this table,we can see that asσ1increases,the estimated precision of all the methods decreases,which is consistent with our intuition.When Qt 0.12I2,the time-averaged RMSEs of the SLS and En CR methods are quite close;and when Qt>0.12I2,the En CR method obtains the smallest time-averaged RMSE.Moreover,when the model error variance is large,i.e.the last several columns of Table 2,the time-averaged RMSE of the W-B,SLS and En CR methods are much smaller than that of the En KF method,and the En CR method maintains the smallest time-averaged RMSE value,which suggests that the estimated accuracy of the En CR method is better than that of the other methods.
| 图表编号 | XD0015818400 严禁用于非法目的 |
|---|---|
| 绘制时间 | 2018.03.10 |
| 作者 | Yong LI、Siming LI、Yao SHENG、Luheng WANG |
| 绘制单位 | School of Statistics, Beijing Normal University、School of Statistics, Beijing Normal University、School of Mathematical Sciences, Beijing Normal University、School of Mathematical Sciences, Beijing Normal University |
| 更多格式 | 高清、无水印(增值服务) |
查看“Table 1.Time-averaged RMSE values of different methods.”的人还看了
-

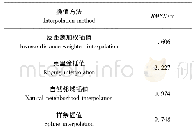
- 表3 草地不同插值方法RMSE计算结果Tab.3 Results of RMSE calculation with different interpolation methods in grass area
-

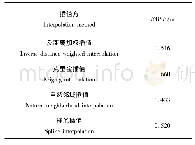
- 表2 城区不同插值方法RMSE计算结果Tab.2 Results of RMSE calculation with different interpolation methods in urban area


