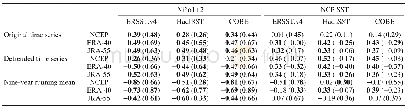
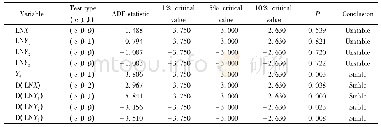
《Table 2.Correlation coefficients among the NTAB/STAB time series, the Nino1+2 index, and the NCP (5
 提示:宽带有限、当前游客访问压缩模式
本系列图表出处文件名:随高清版一同展现
《Asymmetric Variations in the Tropical Ascending Branches of Hadley Circulations and the Associated Mechanisms and Effects》
Although the SSTs in the NCP(5?–15?N,150?E–160?W)may have an impact on the NTAB(Figs.6a,c and e),our results suggest that the NCP SSTs play a role inferior to the eastern Pacific SSTs in modulating the variability of NTAB and STAB.Table 2 shows the correlation coefficients among the time series of the NTAB/STAB index,the time series of the Ni?no1+2 index,and the time series of the NCP regional mean SST for different datasets.By and large,the Ni?no1+2index has a more significant relationship with both the STAB and NTAB than the NCP SST regarding different datasets and regarding the original,detrended,and nine-year running mean time series.Figure 7 shows the synthesized results calculated by averaging the corresponding numbers of different datasets in Tables 1 and 2.For the detrended time series,the correlation between NTAB and STAB is larger than the correlation between NTAB and the Ni?no1+2 index,and is also larger than the correlation between NTAB and the NCP SST(Fig.7a),implying that the interannual variability of NTAB is essentially linked to the STAB–NTAB compensatory effect.On the other hand,the correlation between STAB and NTAB approximates the correlation between STAB and the Ni?no1+2 index(Fig.7b),indicating equally close relationships of STAB with the two factors,i.e.,NTAB and the tropical eastern Pacific SSTs.
| 图表编号 | XD0015818300 严禁用于非法目的 |
|---|---|
| 绘制时间 | 2018.03.10 |
| 作者 | Bo SUN |
| 绘制单位 | Collaborative Innovation Center on Forecast and Evaluation of Meteorological Disasters,Nanjing University of Information Science and Technology、International Pacific Research Center and Department of Atmospheric Sciences,University of Hawaii at Manoa、Nans |
| 更多格式 | 高清、无水印(增值服务) |