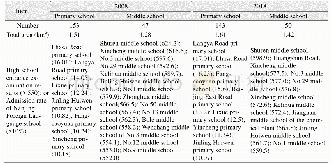
《Table 1.Study areas and their climate characteristics.》
 提示:宽带有限、当前游客访问压缩模式
本系列图表出处文件名:随高清版一同展现
《New Method for Estimating Daily Global Solar Radiation over Sloped Topography in China》
A comparison between the modelled and observed GRHS values under all-sky conditions is shown in Fig.5a,in which we can see that the modelled GRHS is also highly correlated with observations(the correlation coefficient between them is 0.94).The statistical results are presented in Table 2.The mean simulation bias for the 98 solar radiation stations is 1.51MJ m-2d-1and the relative bias is 10.57%.The observational GRHS data in 2003 are further used to test the GMDR model.These data are not used in the development of the model,so the test is independent.Figure 5b shows the same comparison,but using the independent data in 2003.The correlation coefficient for the results in this period is also0.94.The RMSE and r RMSE for this test are 2.16 and13.43%,respectively.
| 图表编号 | XD0015817700 严禁用于非法目的 |
|---|---|
| 绘制时间 | 2018.03.10 |
| 作者 | Guoping SHI、Xinfa QIU、Yan ZENG |
| 绘制单位 | School of Geography and Remote Sensing, Nanjing University of Information Science and Technology、School of Applied Meteorology, Nanjing University of Information Science and Technology、Jiangsu Climate Center |
| 更多格式 | 高清、无水印(增值服务) |


