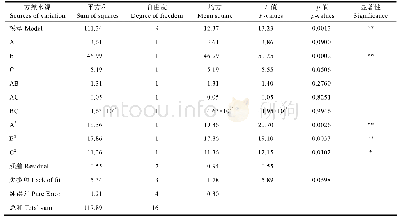
《Table 3.Summary of the linear regression analysis for the wind speed at two stations (x and y are v
 提示:宽带有限、当前游客访问压缩模式
本系列图表出处文件名:随高清版一同展现
《Observational Study of Surface Wind along a Sloping Surface over Mountainous Terrain during Winter》
Figures 6a and b show scatterplots of the wind speed at stations Y3 and Y4 for the easterly and westerly groups,respectively.The different relationships between the wind speeds at two stations are shown for the easterly and westerly groups(Table 3).The wind speed at Y3 for the westerly group shows a broad distribution extending to 10 m s-1,while most of the winds at Y3 for the easterly group have low wind speeds of<2 m s-1.The different range of wind speed at Y3 is due to the fact that station Y3 is located in the leeward region with a velocity deficit in the easterly case,while it is located in the windward region in the westerly case(Fig.5);hence,the wind at Y3 represents upper-level wind in the westerly case.
| 图表编号 | XD0015817600 严禁用于非法目的 |
|---|---|
| 绘制时间 | 2018.03.10 |
| 作者 | Young-Hee LEE、Gyuwon LEE、Sangwon JOO、Kwang-Deuk AHN |
| 绘制单位 | Department of Astronomy and Atmospheric Sciences, Kyungpook National University、Department of Astronomy and Atmospheric Sciences, Kyungpook National University、Numerical Data Application Division, Numerical Modeling Center、Numerical Data Application Divis |
| 更多格式 | 高清、无水印(增值服务) |


