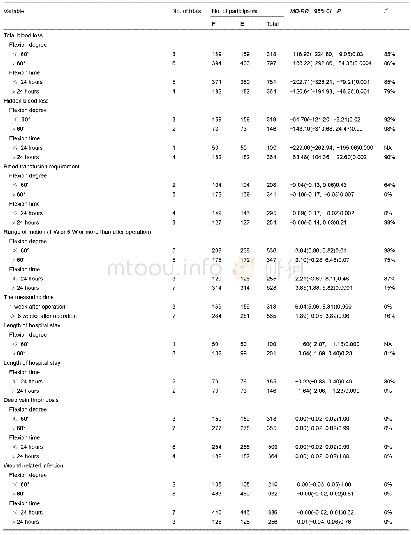
《Table 1 Results of linear regression analysis in the SCI group》
 提示:宽带有限、当前游客访问压缩模式
本系列图表出处文件名:随高清版一同展现
《Dynamic changes in intramedullary pressure 72 hours after spinal cord injury》
SCI:Spinal cord injury;h:hour(s).
IMP rapidly increased during the first 7 hours and then steadily increased during hours 8–38.Although IMP fluctuated during hours 39–72,overall it exhibited a downward trend.Three stages:I(steep rise),II(steady rise),and III(descending)were divided according to the changes in IMP in the SCI group(Figure 4B).The trends of each stage were described by linear regression analysis(Table 1),and there was a significant difference in slopes between stages(P<0.05,F=32.40,df=2;Figure 4C).
| 图表编号 | XD0040615600 严禁用于非法目的 |
|---|---|
| 绘制时间 | 2019.05.01 |
| 作者 | Xin Zhang、Chang-Bin Liu、De-Gang Yang、Chuan Qin、Xue-Chao Dong、Da-Peng Li、Chao Zhang、Yun Guo、Liang-Jie Du、Feng Gao、Ming-Liang Yang、Jian-Jun Li |
| 绘制单位 | School of Rehabilitation Medicine, Capital Medical University、Department of Spinal and Neural Function Reconstruction, China Rehabilitation Research Center、Center of Neural Injury and Repair, Beijing Institute for Brain Disorders、China Rehabilitation Scie |
| 更多格式 | 高清、无水印(增值服务) |


