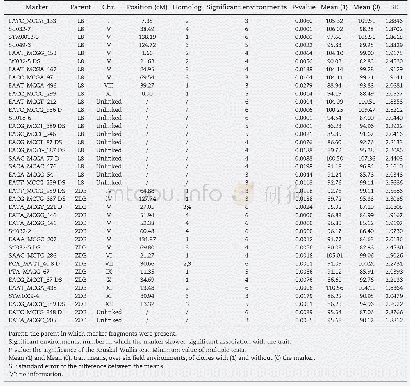
《Table 2–SNP markers significantly associated with vitamin B1 content in the association panel.》
 提示:宽带有限、当前游客访问压缩模式
本系列图表出处文件名:随高清版一同展现
《Genome-wide association mapping of vitamins B1 and B2 in common wheat》
aPosition from the wheat 90 K SNP consensus map[16].bFavorable alleles for increasing vitamin B1 content are underlined.cMinor allele frequency.dAverage indicates the MTA based on the mean phenotypic data from both environments.
There was continuous variation for vitamin B1 and B2contents in both environments(Fig.S1).The averaged vitamin B1 and B2 contents among cultivars ranged from 5.34 to16.74μg g-1and from 0.48 to 0.74μg g-1,respectively.Cultivars Lumai 23,Xiaoyan 22,Zhengmai 366,Zhoumai 16,Nidera Baguette 10,and Nidera Baguette 20 had the highest vitamin B1 contents,whereas Aifeng 3,Xinmai 19,Xiaoyan 54,Bima 1,and Zhengzhou 3 had the highest vitamin B2 contents(Table S1).ANOVA showed significant differences for vitamins B1(P<0.001)and B2 contents(P<0.01)among genotypes(Table 1).No significant differences were identified among three sub-populations for vitamin B2 content,whereas the mean value of vitamin B1 content of sub-population 3 was significantly(P<0.05)less than those of sub-populations 1and 2 based on multiple comparison analysis(Table S2).The heritabilities of vitamin B1 and B2 contents were 0.83 and 0.77,respectively.
| 图表编号 | XD0012321400 严禁用于非法目的 |
|---|---|
| 绘制时间 | 2018.06.01 |
| 作者 | Jieyun Li、Jindong Liu、Wei'e Wen、Pingzhi Zhang、Yingxiu Wan、Xianchun Xia、Yan Zhang、Zhonghu He |
| 绘制单位 | Institute of Crop Science,National Wheat Improvement Center,Chinese Academy of Agricultural Sciences、Institute of Crop Science,National Wheat Improvement Center,Chinese Academy of Agricultural Sciences、Institute of Crop Science,National Wheat Improvement |
| 更多格式 | 高清、无水印(增值服务) |
查看“Table 2–SNP markers significantly associated with vitamin B1 content in the association panel.”的人还看了
-

- Table 1 Characteristics of included studies:Evaluating vitamin D treatment in children with inflammatory bowel disease
-

- Table 4 Urinary marker levels at enrollment between patients with severe and mild pancreatitis by computed tomography Gr


