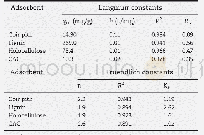
《Table 1 Langmuir adsorption isotherm equation parameters》
 提示:宽带有限、当前游客访问压缩模式
本系列图表出处文件名:随高清版一同展现
《"Study of Isothermal Equilibrium,Kinetics and Thermodynamics of Adsorptive Desulfurization on Synthesized Cu~ⅠY~ⅢY Zeolite"》
A linear correlation between ce/qe and ce in Eq.(2)at different temperatures is shown in Figure 7.The results and the corresponding regression coefficient(R2)at different temperatures are listed in Table 1.The R2 at different temperatures are all near 0.99,showing that the experimental data can be fitted to the Langmuir adsorptive isothermal equation very well.As shown in Figure 7,the slope of the line decreases slightly with an increasing temperature,which proves that qm increases slightly with the increase in temperature,indicating that the affinity between the CuIYIIIY zeolite and BT molecules is enhanced with an increasing temperature.The values of qm obtained from Figure 7 are in good agreement,with the results shown in Figure 6.The Langmuir constant KL decreases with an increasing temperature as evidenced by the data from Table 1,illustrating that the adsorption process is exothermic.
| 图表编号 | XD0011299400 严禁用于非法目的 |
|---|---|
| 绘制时间 | 2018.06.30 |
| 作者 | Li Xiaojuan、Song Hua、Chang Youxin |
| 绘制单位 | College of Chemistry and Chemical Engineering,Northeast Petroleum University、College of Chemistry and Chemical Engineering,Northeast Petroleum University、Provincial Key Laboratory of Oil and Gas Chemical Technology,Northeast Petroleum University、Provincia |
| 更多格式 | 高清、无水印(增值服务) |
查看“Table 1 Langmuir adsorption isotherm equation parameters”的人还看了
-

- 表2 氧化单壁碳纳米角吸附环丙沙星的Langmuir吸附等温式参数Tab.2 Langmuir adsorption isotherm parameters of ciprofloxacin adsorbed by oxSWNHs
-

- Table 3–Langmuir and Freundlich adsorption isotherm for TMA adsorption by coir pith, lignin and holocellulose extracted


